

LiveAPI Plotting And Mapping
Copyright 2025 Google LLC.
Gemini 2.X - Multi-tool with the Multimodal Live API

In this notebook you will learn how to use tools, including charting tools, Google Search and code execution in the Gemini 2 Multimodal Live API. For an overview of new capabilities refer to the Gemini 2 docs.
This notebook is written in Python and uses the secure Websockets protocol directly, it does not use the GenAI SDK.
If you aren't looking for code, and just want to try multimedia streaming use Live API in Google AI Studio.
Get set up
━━━━━━━━━━━━━━━━━━━━━━━━━━━━━━━━━━━━━━━━ 169.9/169.9 kB 5.1 MB/s eta 0:00:00
Set up your API key
To run the following cell, your API key must be stored it in a Colab Secret named GOOGLE_API_KEY. If you don't already have an API key, or you're not sure how to create a Colab Secret, see the Authentication  quickstart for an example.
Multimodal Live API are a new capability introduced with the Gemini 2.0 model. It won't work with previous generation models.
You also need to set the client version to v1alpha.
Set up some helpers
Before interacting with the API, define some helpers that you'll need in this codelab.
In this notebook, you'll be buffering the streamed PCM audio responses, so create a context manager to wrap the PCM audio data in a wave audio file with the relevant audio parameters. This way, you can play the audio back directly within Colab.
Use a custom logger so you can easily toggle the log level in order to see in-flight requests and responses from the API.
Define connection functions
This code defines some functions that will connect to (quick_connect), execute and handle prompts (run) and handle specific server responses (handle_tool_call, handle_server_content).
This code uses the websockets PyPI package, specifically the async interface available in 14.0 and will not work with significantly older packages.
Use the API
One-turn example
Now, let's see how all the pieces you've defined fit together in a simple example. You'll send a single prompt to the API and observe the response.
This example uses the quick_connect context manager to create a connection to the API. As long as you're inside the async with block, the connection remains active and is accessible through the ws variable. Then use the run function to send our prompt and process the API's response.
Make a simple request to understand how the above code works. A connection is created through a context manager using quick_connect, and while the context is active, the web-socket connection is stored in ws, and passed to subsequent run calls that execute the prompts.
Note that you can change the modality from AUDIO to TEXT. and adjust the prompt.
> Please find the last 5 Denis Villeneuve movies and look up their runtimes and the year published. Based on the search results, the last 5 Denis Villeneuve movies are: 1. *Dune: Part Two* (2024) 2. *Dune: Part One* (2021) 3. *Blade Runner 2049* (2017) 4. *Arrival* (2016) 5. *Sicario* (2015) Now, let's find the runtimes for these movies. Here's a summary of the last 5 Denis Villeneuve movies, their release year, and runtime: * **Dune: Part Two** (2024): 166 minutes (2 hours 46 minutes) * **Dune: Part One** (2021): 155 minutes (2 hours 35 minutes) * **Blade Runner 2049** (2017): 163 minutes (2 hours 43 minutes) * **Arrival** (2016): 116 minutes (1 hour 56 minutes) * **Sicario** (2015): 121 minutes (2 hours 1 minute) <Turn complete>
Complex multi-tool example
Now define additional tools. Add a tool for charting by defining a schema (in altair_fns), a function to execute (render_altair) and connect the two using the tool_calls mapping.
The charting tool used here is Vega-Altair, a "declarative statistical visualization library for Python". Altair supports chart persistance using JSON, which you will expose as a tool so that the Gemini model can produce a chart.
The helper code defined earlier will run as soon as it can, but audio takes some time to play so you may see output from later turns displayed before the audio has played.
Now put that all together into a chat conversation. This code opens a streaming session (with quick_connect), and each run invocation will send the text prompt, read the streamed response (and buffer if it's audio), handle any server responses (such as tool calls) and finally return once the end-of-turn signal has been sent.
By sequencing multiple run calls within a quick_connect session, you are executing a multi-turn, streamed, conversation. Once the code reaches the end of the quick_connect block, the session is terminated.
> Please find the last 5 Denis Villeneuve movies and find their runtimes. ....................................................................................................................... <Turn complete>
> Can you write some code to work out which has the longest and shortest runtimes? ..................................................... <Turn complete> Pausing for audio to complete...
> Now can you plot them in a line chart showing the year on the x-axis and runtime on the y-axis?
<ipython-input-10-14ecbacb69f1>:7: AltairDeprecationWarning:
Deprecated since `altair=5.5.0`. Use altair.theme instead.
Most cases require only the following change:
# Deprecated
alt.themes.enable('quartz')
# Updated
alt.theme.enable('quartz')
If your code registers a theme, make the following change:
# Deprecated
def custom_theme():
return {'height': 400, 'width': 700}
alt.themes.register('theme_name', custom_theme)
alt.themes.enable('theme_name')
# Updated
@alt.theme.register('theme_name', enable=True)
def custom_theme():
return alt.theme.ThemeConfig(
{'height': 400, 'width': 700}
)
See the updated User Guide for further details:
https://altair-viz.github.io/user_guide/api.html#theme
https://altair-viz.github.io/user_guide/customization.html#chart-themes
with alt.themes.enable(theme):
.................................................... <Turn complete>
Any requests? > can you add the movie names into the dots as also make it in a dark theme? > can you add the movie names into the dots as also make it in a dark theme?
............................. <Turn complete>
Maps example
For this example you will use the Google Maps Static API to draw on a map during the conversation. You'll need to make sure your API key is enabled for the Google Maps Static API. It can be the same API key as you used for the Gemini API, or a new one, as long as the Static Maps API is enabled.
Add the key in Colab Secrets, or add it in the code directly (MAPS_API_KEY = 'AIza...').
The following cell is hidden by default, but needs te be run. It comtains the function schema for the draw_map function, including some documentation on how to draw markers with the Google Maps API.
Note that the model needs to produce a fairly complex set of parameters in order to call draw_map, including defining a center-point for the map, an integer zoom level and custom marker styles and locations.
Now define the draw_map function and add google_search as a tool to use for this conversation. This will allow the model to look up restaurants that might be popular.
Finally, define and run the conversation.
The output for the first image will look something like this. Don't worry if yours is slightly different, there are many popular restaurants, and many ways to style a map. You can always ask the model for more specific guidance if you wish.

Maps with Code execution
In this example, you will use the Google Maps tools defined before, and you'll challenge the model to generate a color gradient and uses it to visually represent data on a map. This task requires code execution, so it is also included as a tool.
Specifically, you will ask the model to plot the capital cities in Australia, and apply a gradient between two colors in a circular direction around the country using Google Maps markers.
The final image should look something like this.
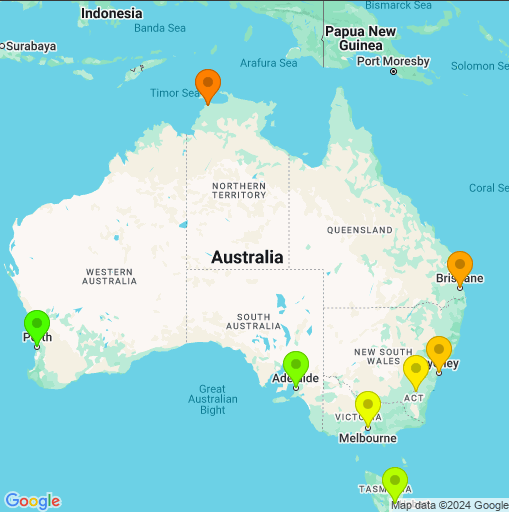
Performance in this example depends on your feedback to get the output perfect. This example showed the first 2 steps of a hypothetical conversation, but you could keep iterating with the model until the results are what you need.
Next steps
This guide shows more intermedite use of the Multimodal Live API over Websockets.
- To try multimodal streaming, use Live API in Google AI Studio - no code required.
- Check out the Live API starter using the Python SDK or using websockets.
- Try some other grounding examples.
- Try the Tool use in the live API tutorial for a walkthrough of Gemini live tool use capabilities.
Or just check the other Gemini capabilities illustrated in the Cookbook examples .