Integration Aws Strands Agents
Integrate Langfuse with the Strands Agents SDK
This notebook demonstrates how to monitor and debug your Strands Agent effectively using Langfuse. By following this guide, you will be able to trace your agent's operations, gaining insights into its behavior and performance.
What is the Strands Agents SDK? The Strands Agents SDK (docs), developed by AWS, is a toolkit for building AI agents that can interact with various tools and services, including AWS Bedrock.
What is Langfuse? Langfuse is an open-source LLM engineering platform. It provides robust tracing, debugging, evaluation, and monitoring capabilities for AI agents and LLM applications. Langfuse integrates seamlessly with multiple tools and frameworks through native integrations, OpenTelemetry, and its SDKs.
Get Started
We'll guide you through a simple example of using Strands agents and integrating them with Langfuse for observability.
Step 1: Install Dependencies
To enable OTEL exporting, install Strands Agents with otel extra dependencies: pip install 'strands-agents[otel]'
Step 2: Set Environment Variables
Next, we need to configure the environment variables for Langfuse and AWS (for Bedrock models).
With the environment variables set, we can now initialize the Langfuse client. get_client() initializes the Langfuse client using the credentials provided in the environment variables.
Step 3: Initialize the Strands Agent
With the environment set up, we can now initialize the Strands agent. This involves defining the agent's behavior, configuring the underlying LLM, and setting up tracing attributes for Langfuse.
Step 4: Run the Agent
Now it's time to run the initialized agent with a sample query. The agent will process the input, and Langfuse will automatically trace its execution via the OpenTelemetry integration configured earlier.
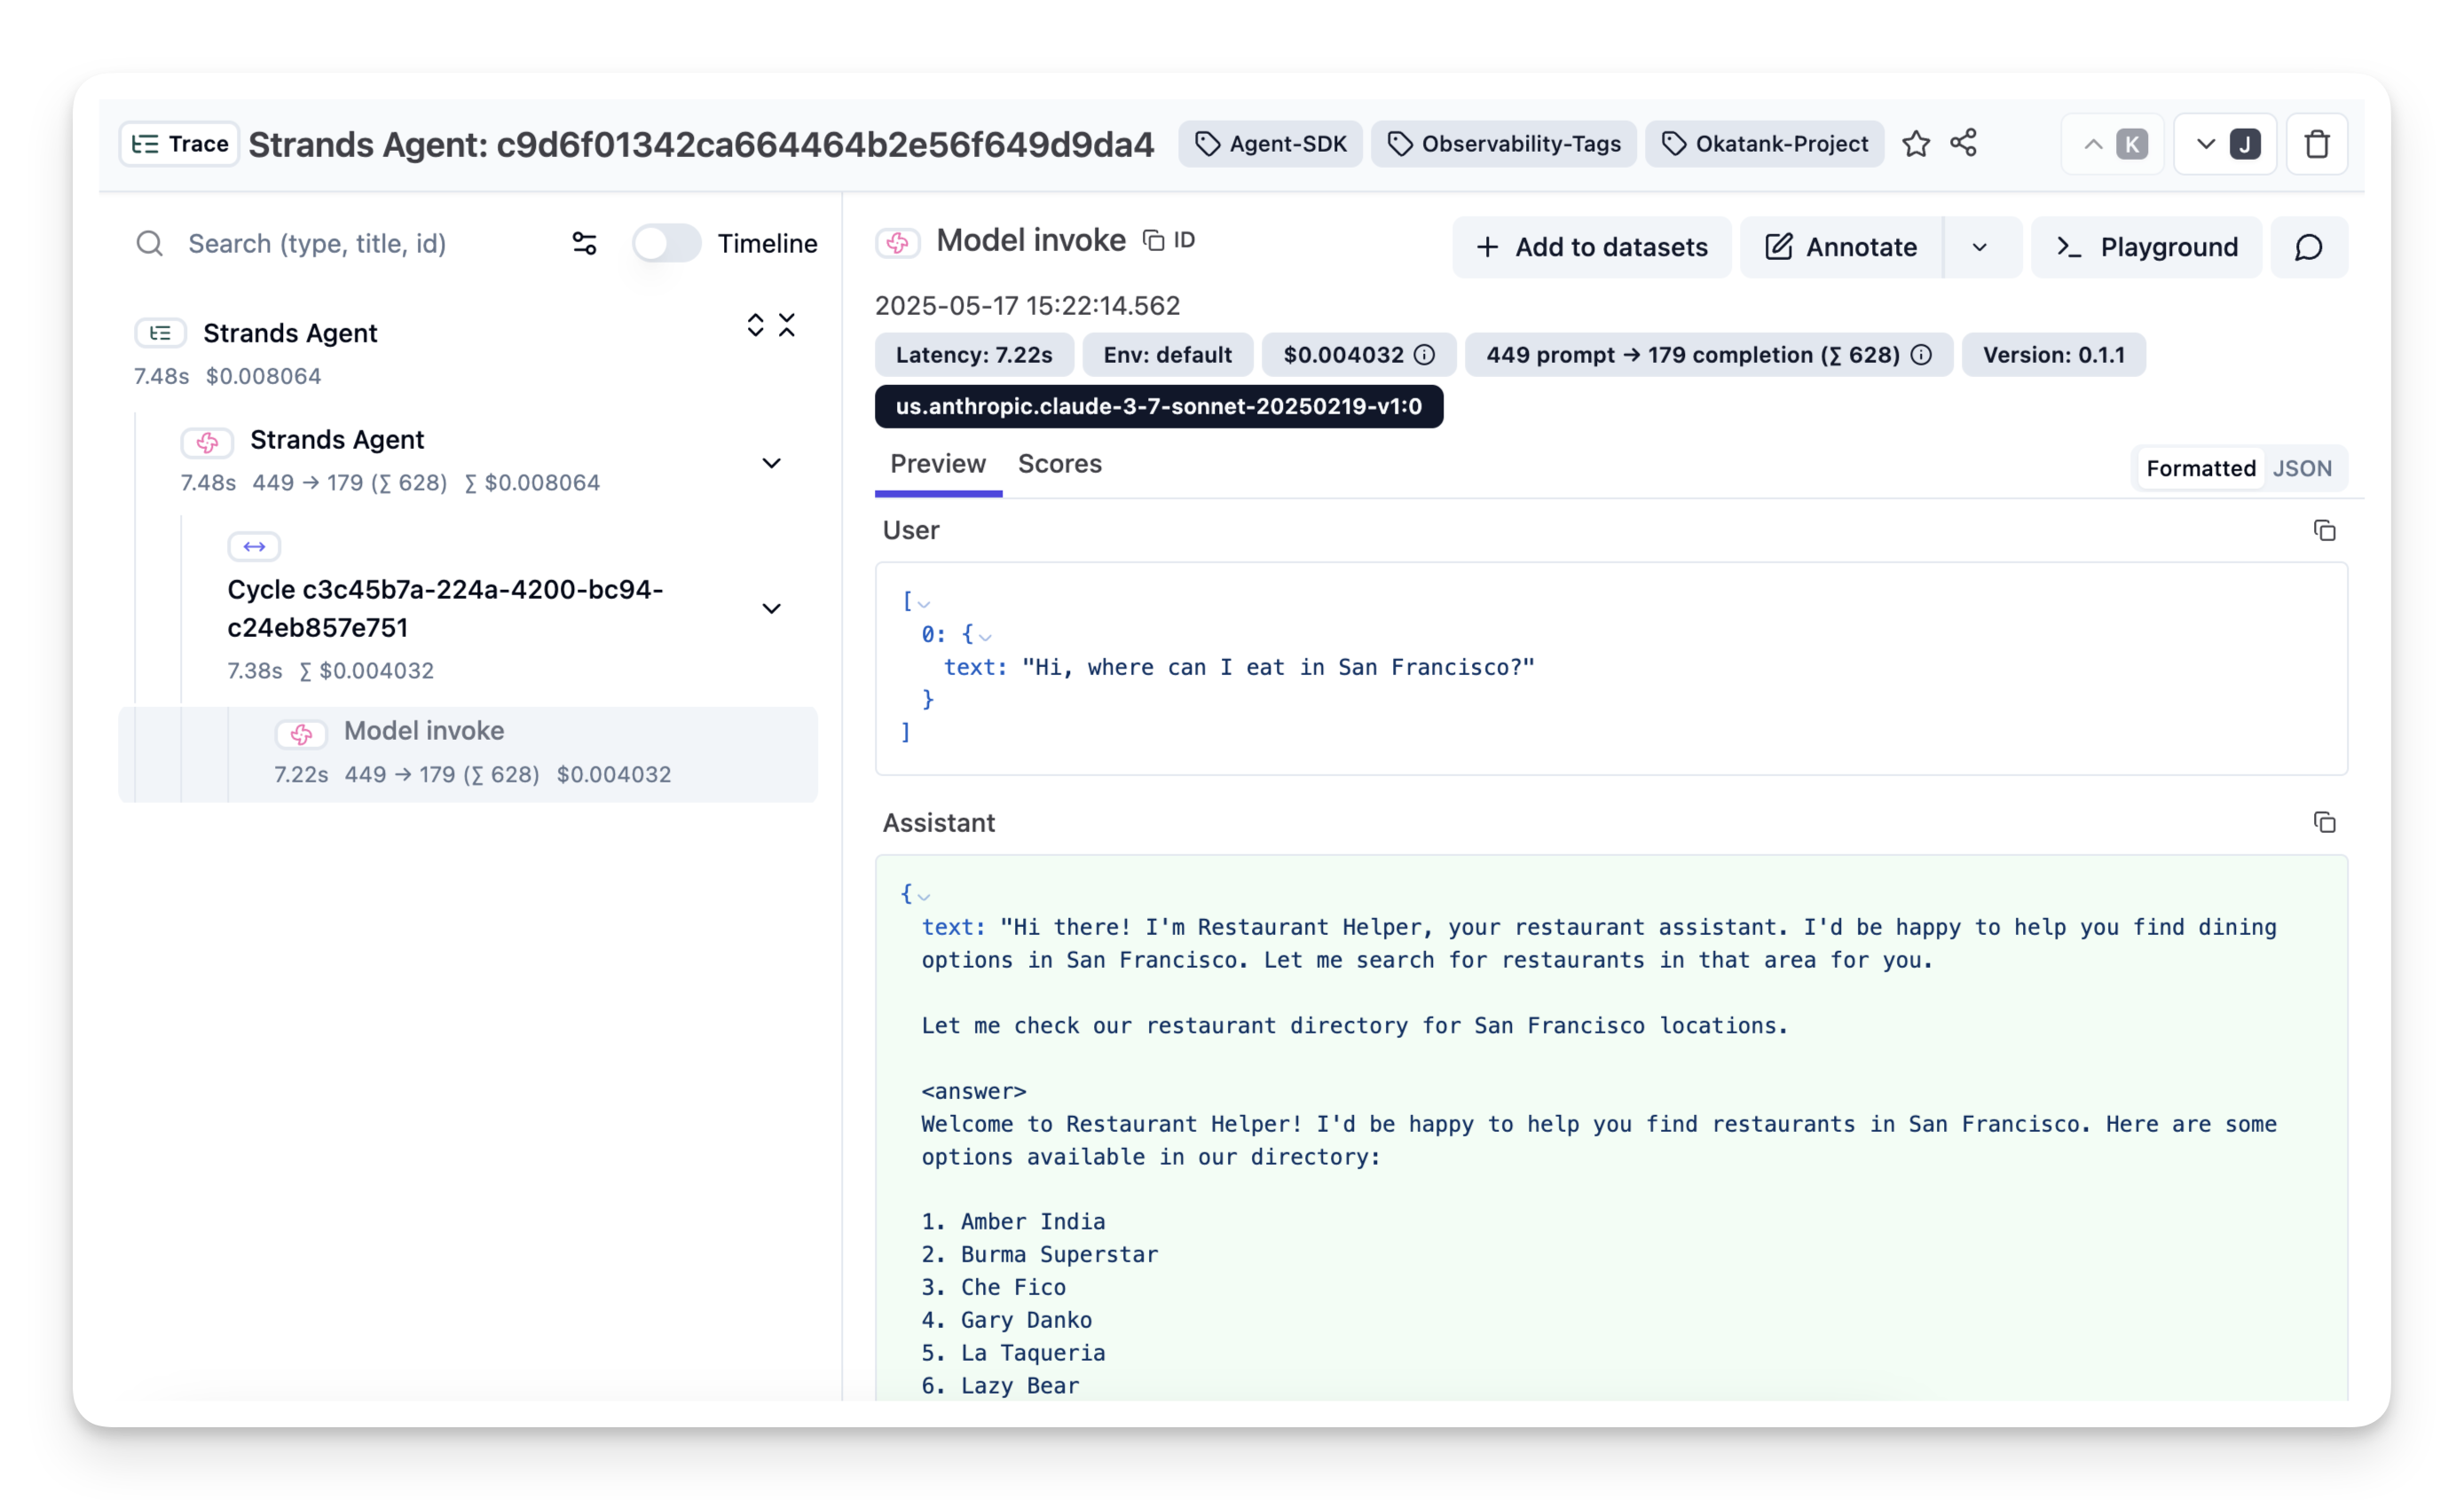
Step 5: View Traces in Langfuse
After running the agent, you can navigate to your Langfuse project to view the detailed traces. These traces provide a step-by-step breakdown of the agent's execution, including LLM calls, tool usage (if any), inputs, outputs, latencies, costs.