Otel Integration Python Sdk
title: Using OpenTelemetry SDK with Langfuse OTel API
Example: Using OpenTelemetry SDK with Langfuse OTel API
This notebook demonstrates how to use any OpenTelemetry SDK to send traces to Langfuse. OpenTelemetry is a CNCF project that provides a standard way to collect distributed traces and metrics from applications.
Langfuse operates as an OpenTelemetry Backend and maps the received traces to the Langfuse data model according to the OpenTelemetry Gen AI Conventions. See the property mapping documentation for details on how attributes are parsed.
In this example, we'll use the Python OpenTelemetry SDK to send traces with GenAI attributes to Langfuse.
Setup
⚠️ Note: We have a new OpenTelemetry native Langfuse SDK. Please check out the SDK v3 for a more powerful and simpler to use SDK.
Configure tracer_provider and add a span processor to export traces to Langfuse. OTLPSpanExporter() uses the endpoint and headers from the environment variables.
Flattened attributes
Opentelemetry lets you attach a set of attributes to all spans by setting set_attribute.
GenAI Semantic Convention Attributes:
Langfuse Attributes:
set_attribute allows you to set properties like a Langfuse Session ID, to group traces into Langfuse Sessions or a User ID, to assign traces to a specific user. You can find a list of all supported attributes in the here.
JSON-serialized attributes
Export a span using JSON-serialized attributes
Dataset Experiments when using OpenTelemetry
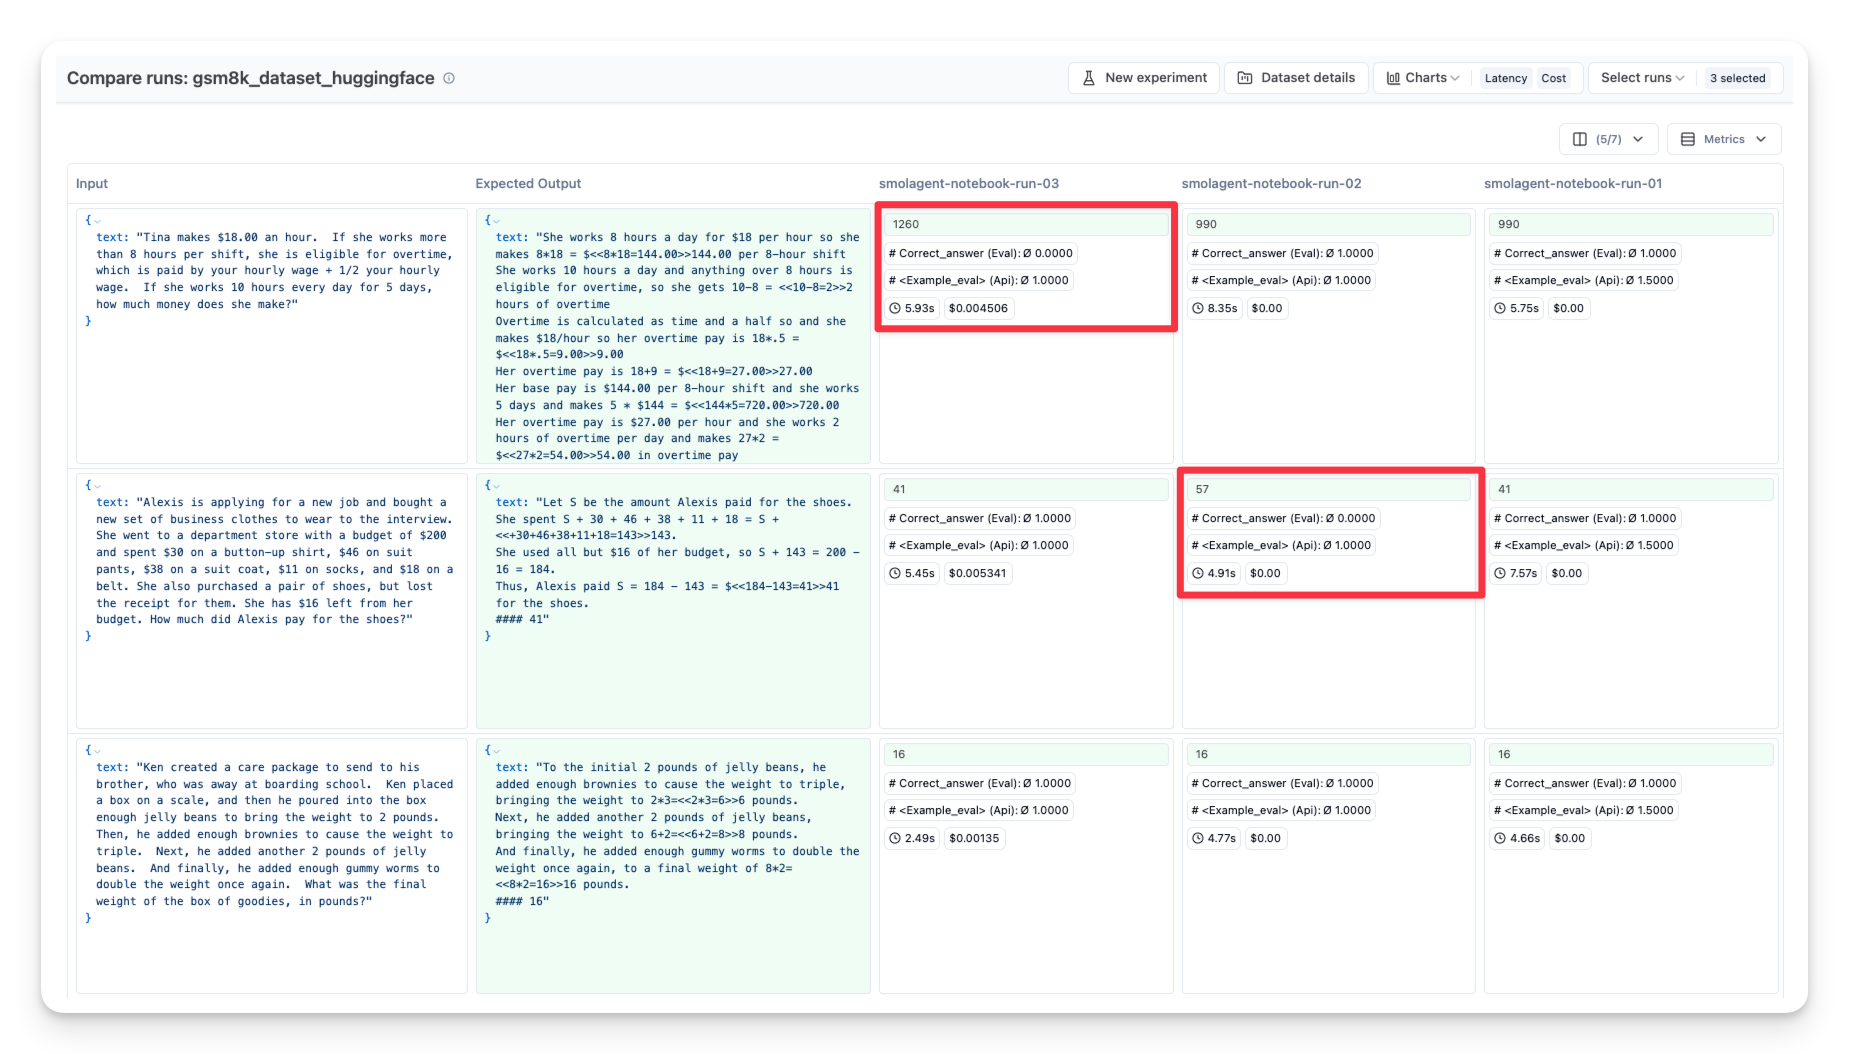
You can also test your smolagents using Langfuse Dataset Experiments:
- Create a benchmark dataset (with prompt and expected output pairs)
- Run your agent on that dataset
- Compare outputs to the expected results or use an additional scoring mechanism
Below, we demonstrate this approach with the GSM8K dataset, which contains math questions and solutions.
Then loop over the dataset items and run the application.
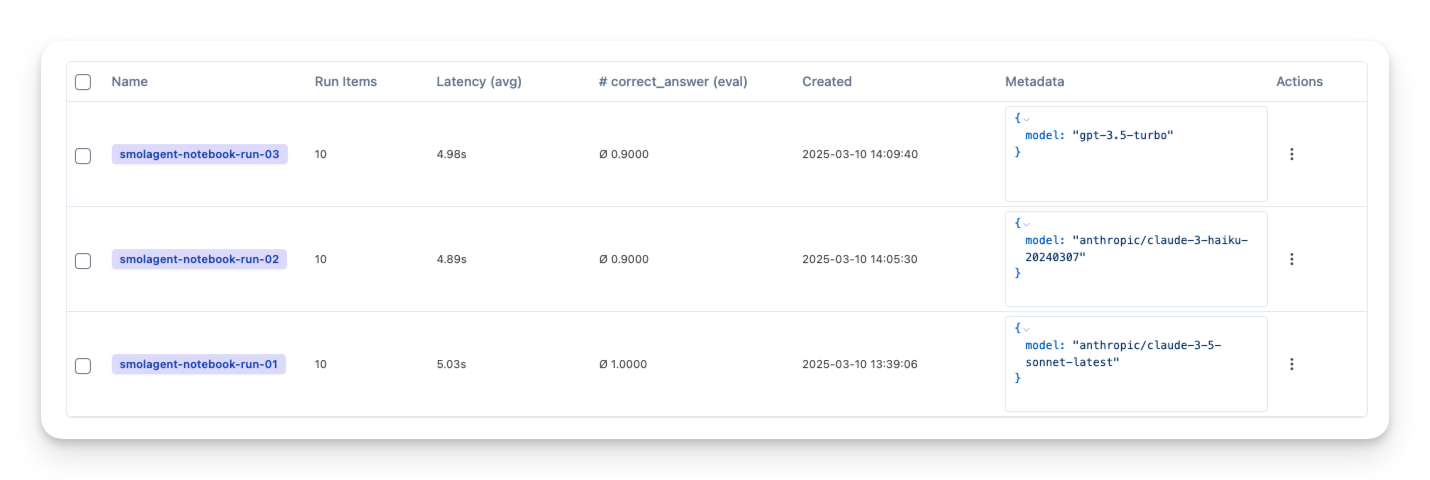
You can repeat this process with different:
- Models (OpenAI GPT, local LLM, etc.)
- Prompts (different system messages)
Then compare them side-by-side in your observability tool: